Excel Data/Information Presentation
Excel is a powerful spreadsheet software that allows you to store, organize, manipulate, and analyze data in various ways. It can help you perform complex calculations, create charts and graphs, manage lists and databases, and automate tasks with macros and VBA. Excel is widely used in different industries and functions, such as finance, accounting, marketing, human resources, operations, and more.
Here are some of the main reasons why Excel is so useful to a business, with examples:
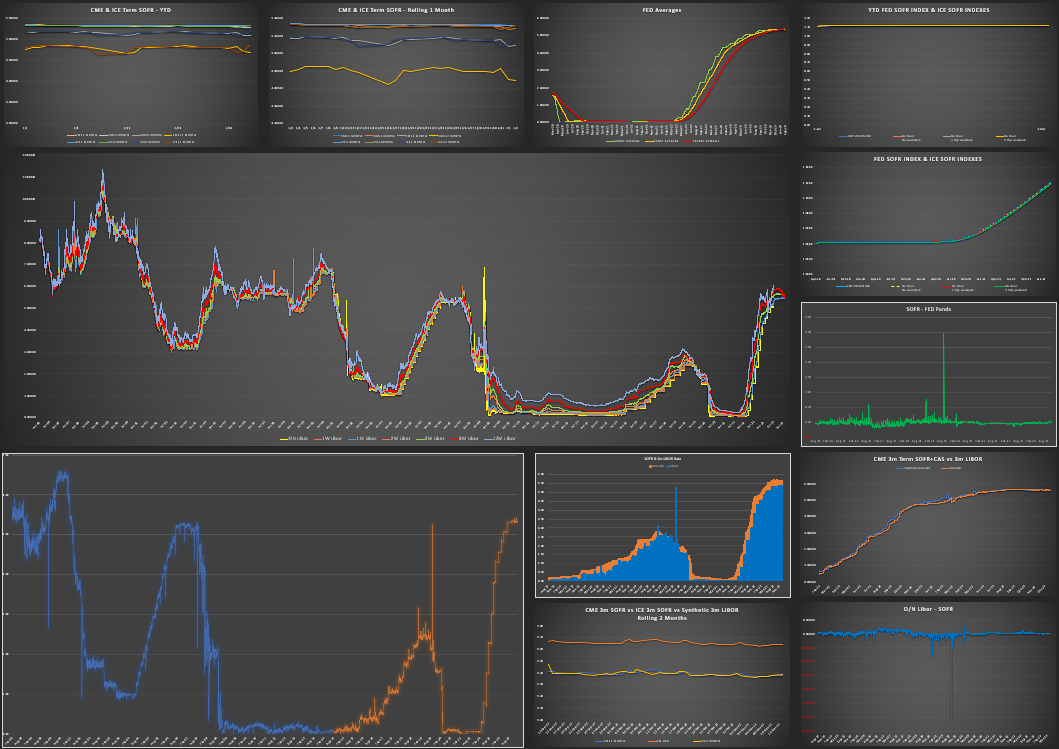
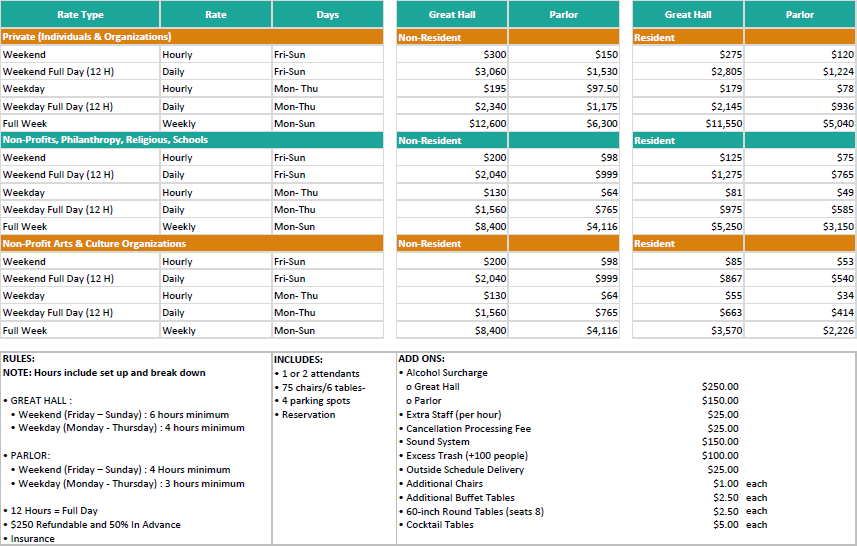
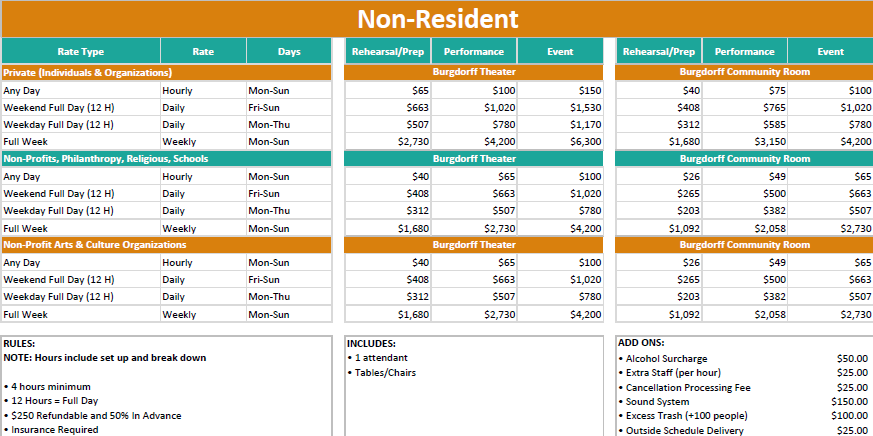
Business analysis: Excel can help you collect and process data from various sources, such as web pages, databases, text files, or other spreadsheets. You can use Excel’s built-in functions and formulas to perform statistical, financial, logical, or mathematical operations on your data. You can also use Excel’s features such as pivot tables, slicers, filters, and conditional formatting to summarize, sort, filter, and visualize your data in different ways. For example, you can use Excel to analyze market data, sales trends, customer behavior, market share, profitability, cash flow, and more.
Managing lists : Excel can help you create and maintain lists of people, such as customers, employees, suppliers, or contacts. You can use Excel’s data validation, data entry forms, and data protection tools to ensure the accuracy and security of your data. You can also use Excel’s lookup and reference functions, such as VLOOKUP, INDEX, and MATCH, to find and retrieve information from your lists. For example, you can use Excel to manage your customer relationship management (CRM) system, your employee payroll and benefits, your inventory and orders, or your email marketing campaigns.
Operations management : Excel can help you plan and optimize your business operations, such as production, distribution, scheduling, or project management. You can use Excel’s solver, goal seek, and scenario manager tools to find the best solutions for your problems, such as minimizing costs, maximizing profits, or meeting deadlines. You can also use Excel’s Gantt chart, network diagram, or calendar templates to create and track your project timelines, milestones, and dependencies. For example, you can use Excel to plan your production capacity, allocate your resources, schedule your deliveries, or monitor your project progress.
Performance reporting : Excel can help you create and present professional and attractive reports that showcase your business performance, such as sales reports, financial statements, dashboards, or scorecards. You can use Excel’s charting and formatting options, such as sparklines, icons, colors, fonts, and styles, to enhance the appearance and readability of your reports. You can also use Excel’s data analysis tools, such as trendlines, error bars, histograms, or regression analysis, to highlight the key insights and patterns in your data. For example, you can use Excel to create a sales report that shows your monthly revenue, growth rate, and target achievement, with charts and indicators that illustrate your strengths and weaknesses.


